PDF downloads and Google Analytics
Please consider creating pages for any information you are providing via PDFs. Web and mobile users have better experiences with pages over PDFs.
Understanding the file downloads of your site can help you understand which information people are seeking. Our university Google analytics has been set up to track file downloads automatically, but there are a couple ways to customize the reports in GA4 to better suit your needs.
Note: this method does work for all types of files and not just PDFs. PDF files on our website represent the largest portion of file download events.
This article uses GA4 specific words (events, dimensions, explore and reports) throughout. For more context, review the GA4 terminology.
Please email webservices@k-state.edu if you are having issues accessing analytics and the reporting features.
Where to find file downloads data
There are two ways to view file downloads, or pdf clicks, in Google Analytics. This data can give you insight into how users are interacting with your information on- and offline.
File downloads in Reports
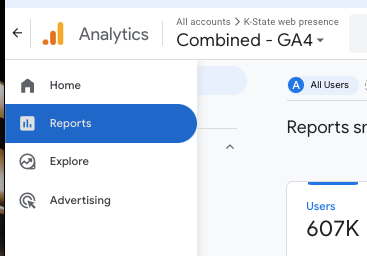
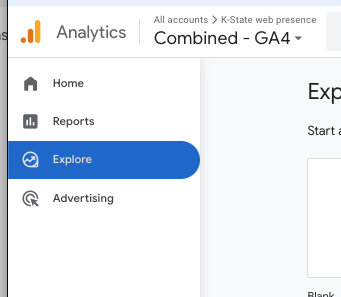
To start, navigate to your site GA4 on Google Analytics. In the left hand menu, you will see Home, Reports, Explore and Advertising.
If you would like to request access, email webservices@k-state.edu with a link to the site.
Click Reports to open up the reports dashboard.
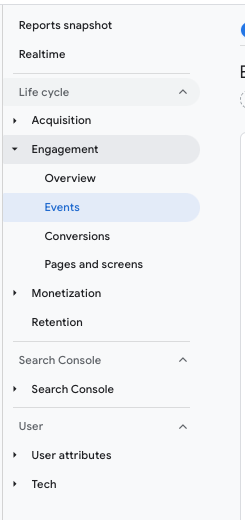
In the next menu, expand the Engagement list and select Events.
In the main window, you should now see a graph with a table below outlining the total events during the selected period of time.
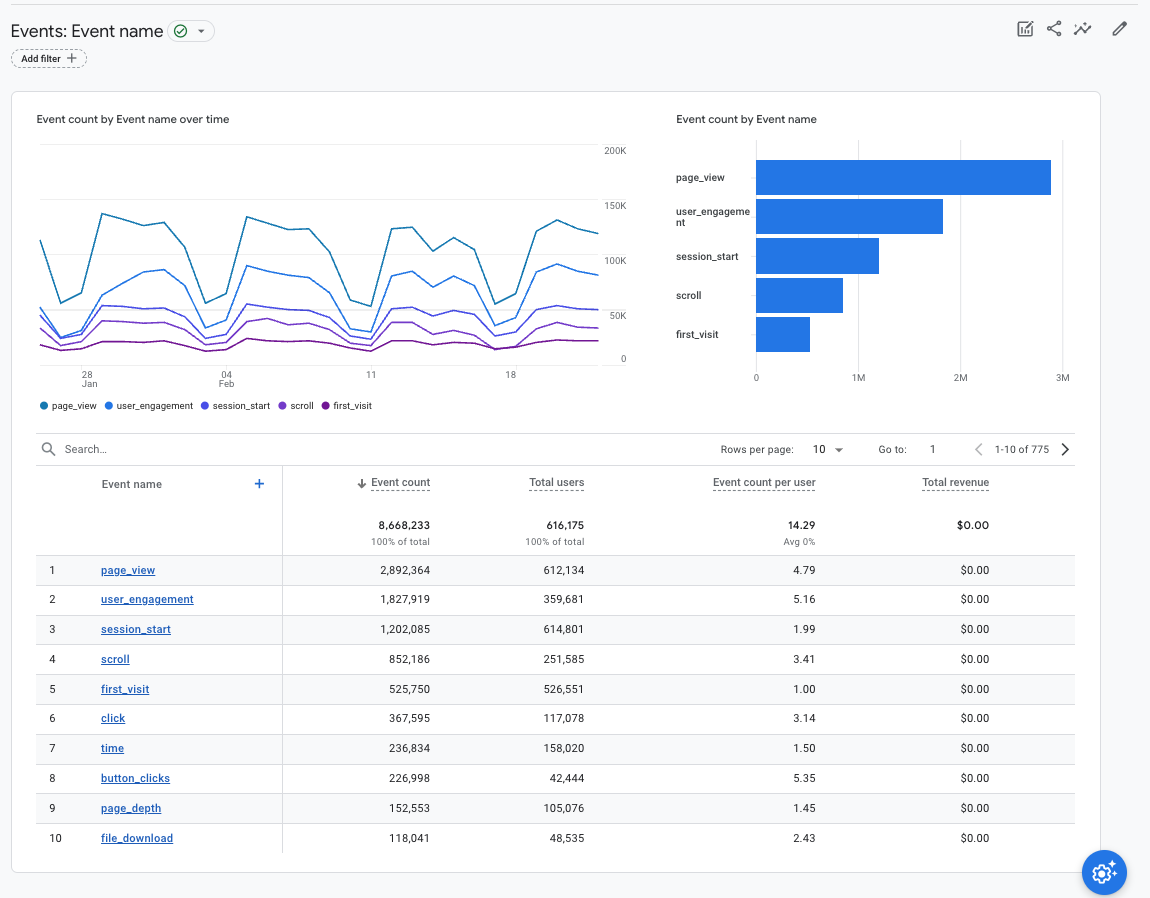
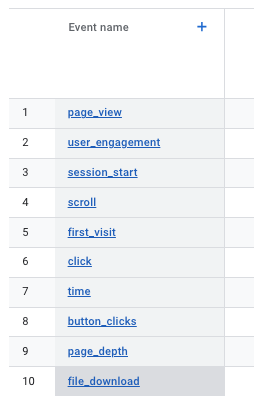
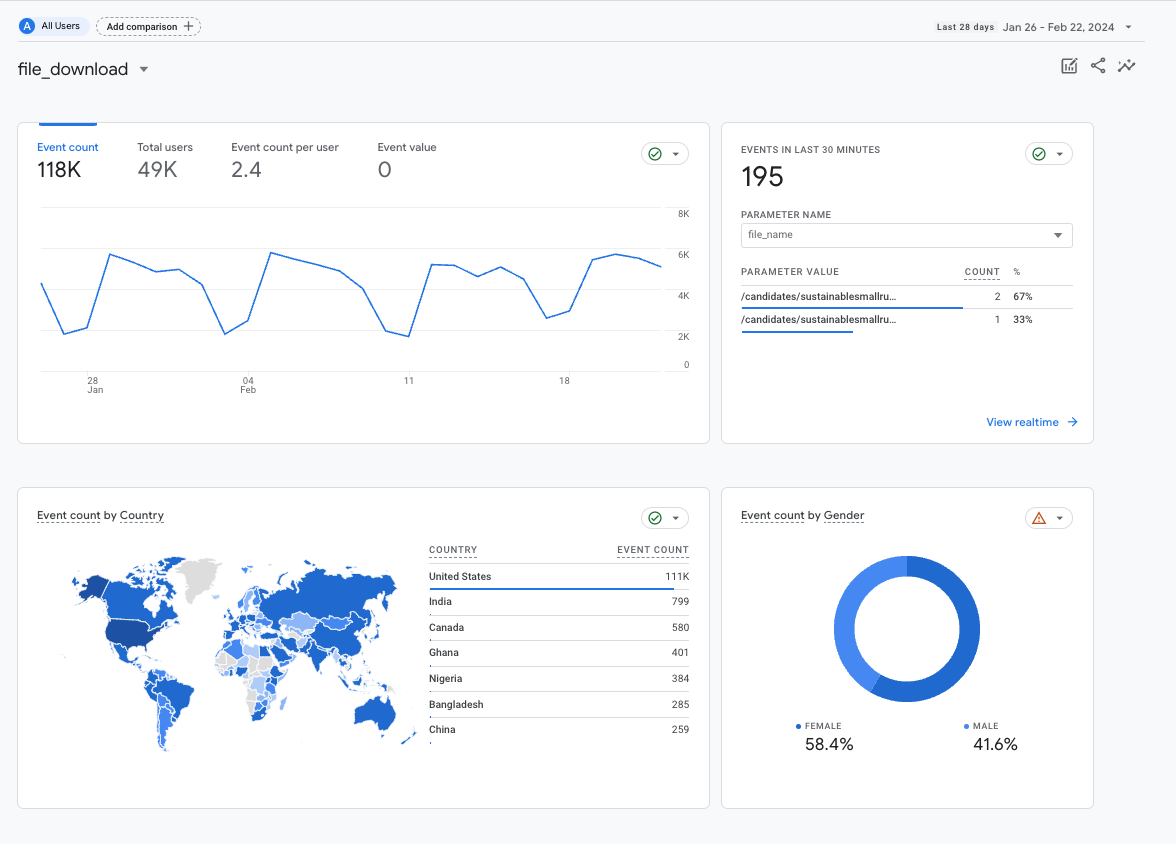
In this case, you want to find the event called file_download by scanning the list or using the search bar.
In the next window, you will see an overview of the file_download event for the selected period of time. This page will show parameters associated with the event and display how many times the event has been triggered in the last 30 minutes.
File downloads in Explore
Using Explorations in Google Analytics allows you curate the information you would like to evaluate. To understand PDF use on our websites, we will use the free form exploration tool. Review the GA4 Exploration help document if you are new to free form explorations.
In the main navigation on the left, choose Explore.
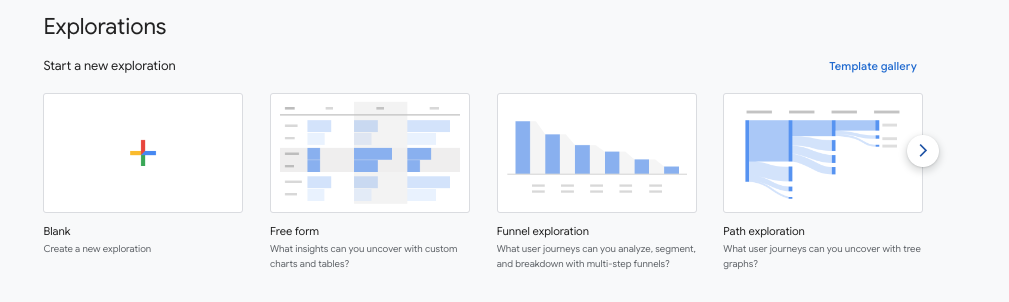
This page will show you any previous exploration you have created and give you options to start a new one.
Select the left option that says Blank. Alternatively, you can start from the free form template, but you will end up with data pieces you don't need.
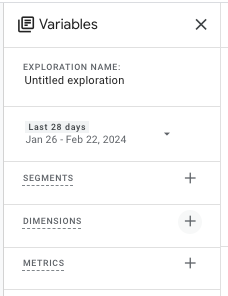
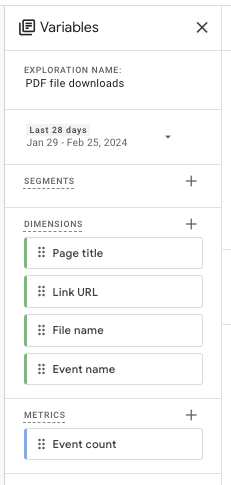
To get started, we will rename the exploration, select our variables and date range. GA4 defaults to the previous 28 days, but gives you the option to use any window and compare the previous time segment.
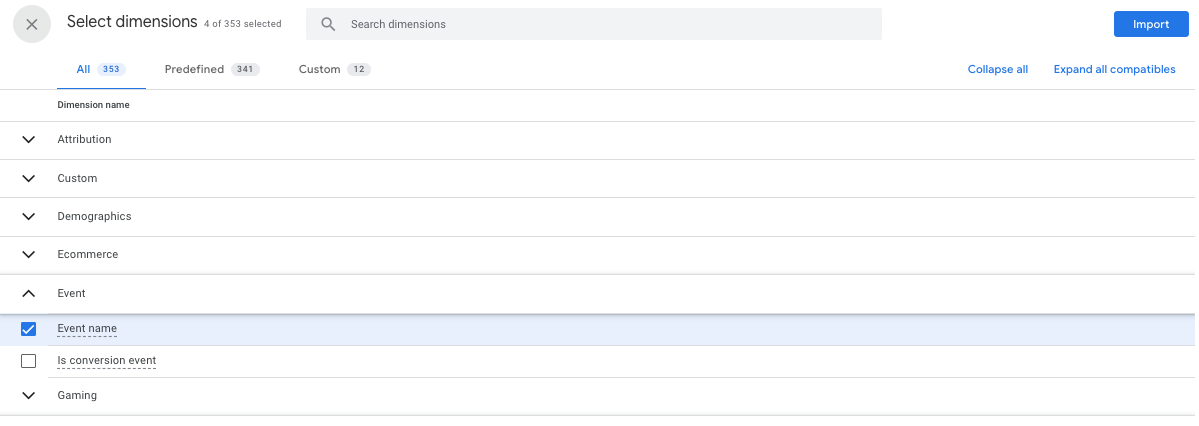
Next to the word dimensions, click the plus sign.
In the search bar, search for event name, link URL, page title and file name, checking the box next to each as you go. Click import on the right to add them to the exploration.
Next, click the plus sign next to metrics. Import event count in the same way as the dimensions. You will see all options ready for use when imported.
Drag or double-click file name and page title to add them to the rows section of the exploration settings.
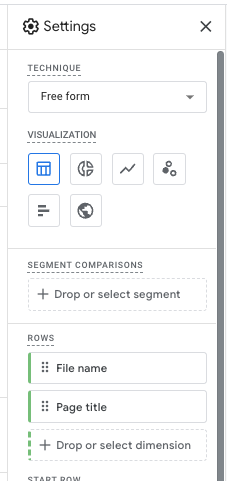
Drag or double-click event count to add the metric value to the rows. At the bottom of the settings panel, click to add a filter. Select event name as the dimension to exactly match file_download to filter only events where the file_download event has fired.
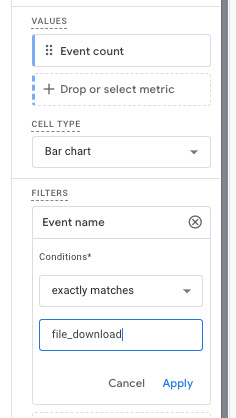
The sheet now should show the path of the file and where the file was downloaded from.
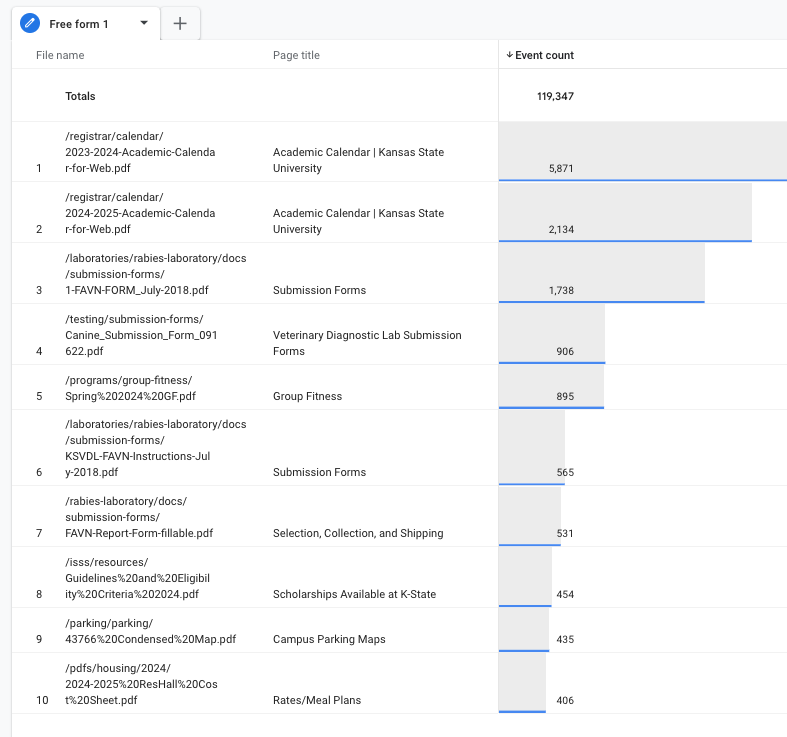
From here, you can change the views by adjusting the number of rows shown and the time period. These explorations are dynamic and you can change the time period, dimensions and metrics to get different results.